
AI Website Health Monitor
This guide walks you through every feature of the AI Local Market Domination tool—from starting a market analysis, to reading competitor insights, to viewing your full health and performance dashboard with AI-powered recommendations.
1. Overview
AI Local Market Domination helps you:
-
Analyze competitors in your local area
-
Identify weaknesses and opportunities
-
Improve your local presence
-
Boost your visibility in maps, search, and local directories
-
Understand how your business compares to others nearby
The system uses real-time data + AI insights to make the analysis simple and actionable.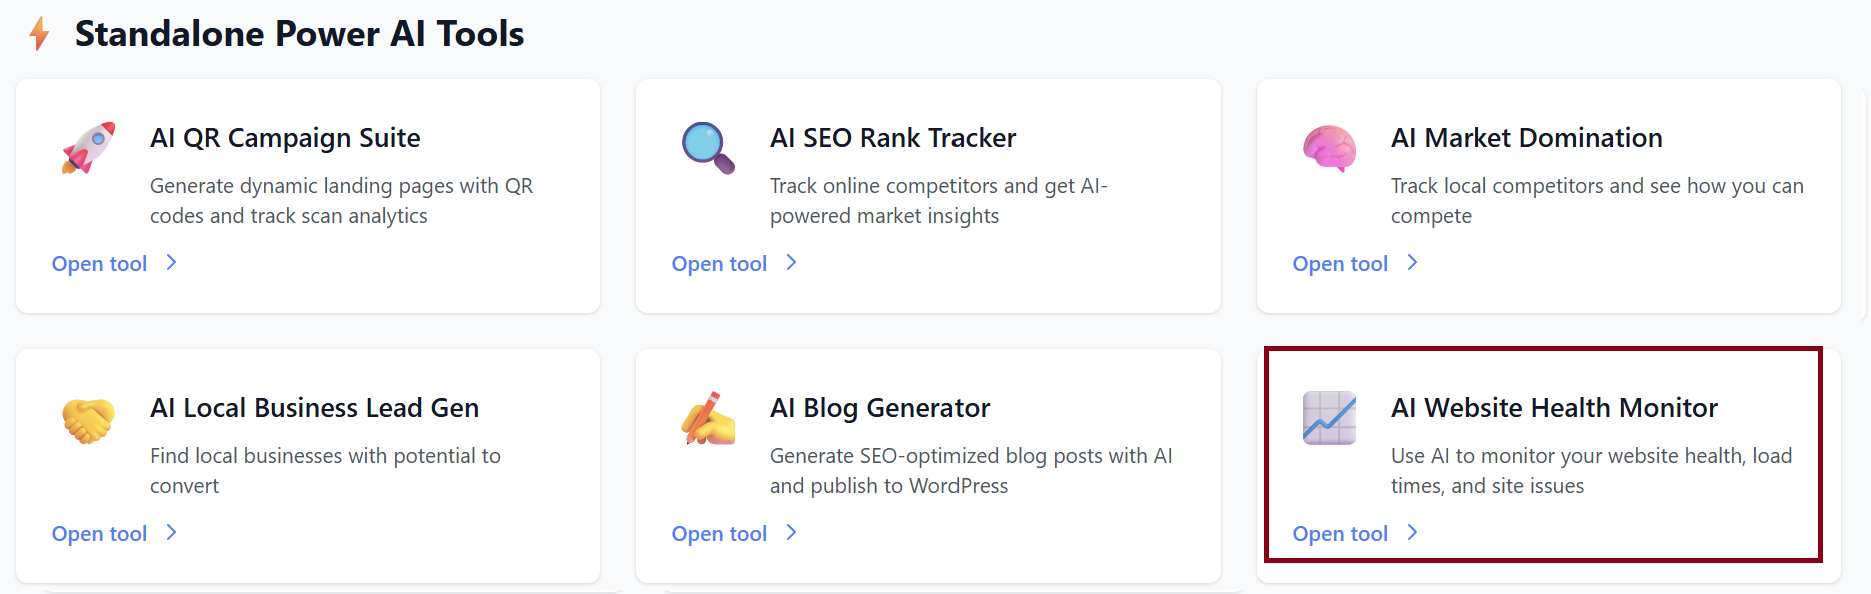
2. Starting a New Market Analysis
When you first open the tool, you will see:
Start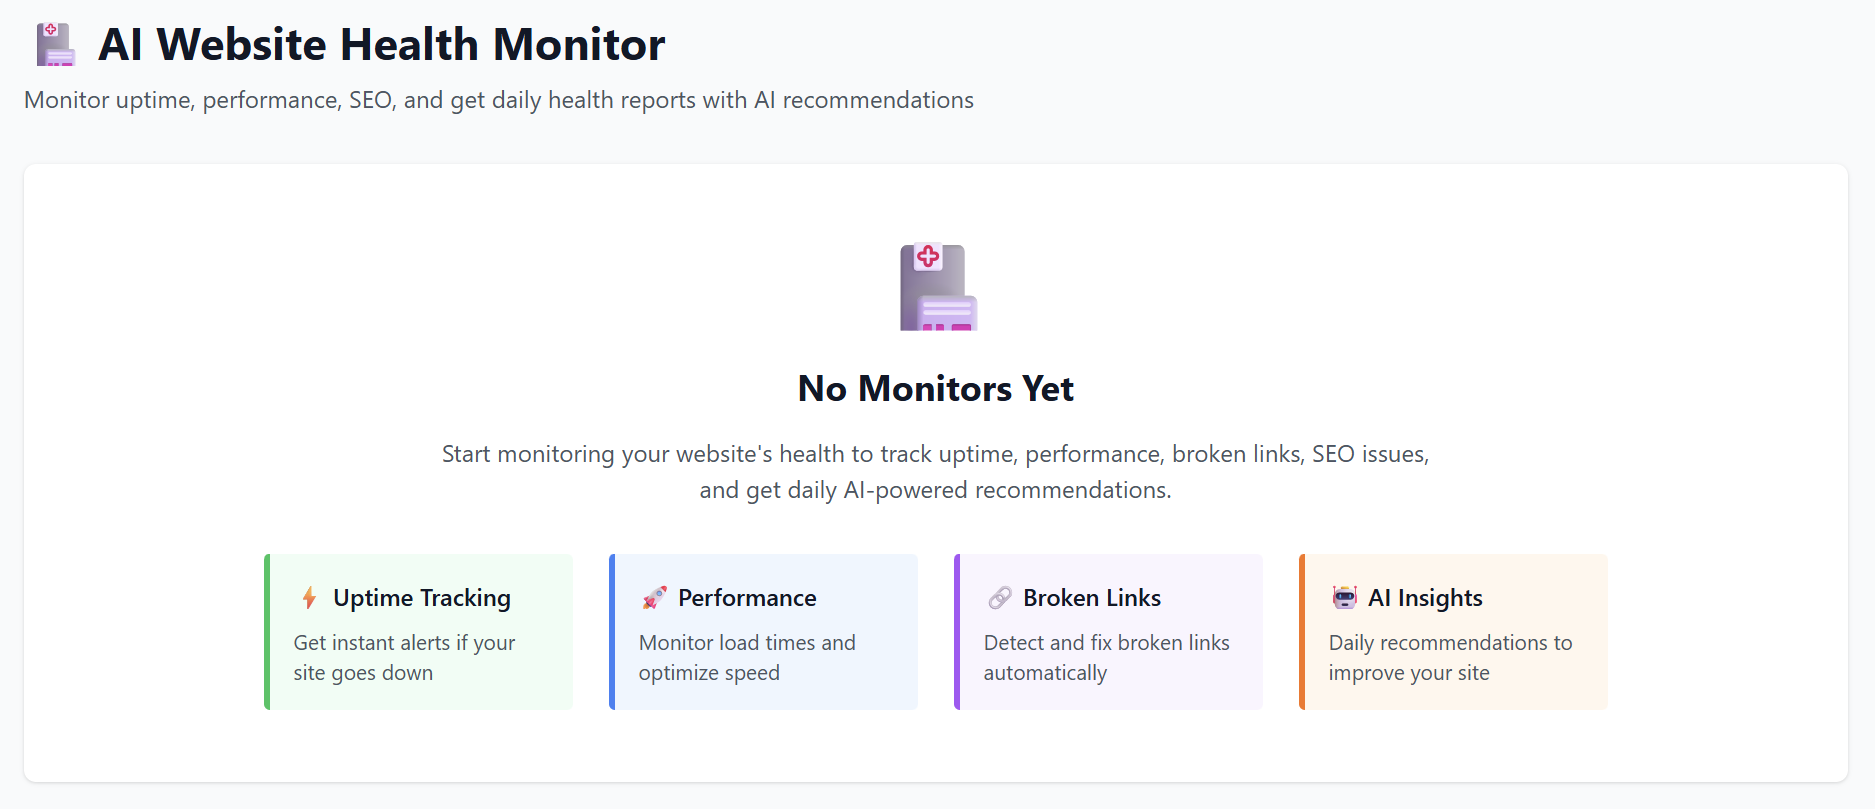
to start a New Market AnalysisAnalysis, fill in the following fields:
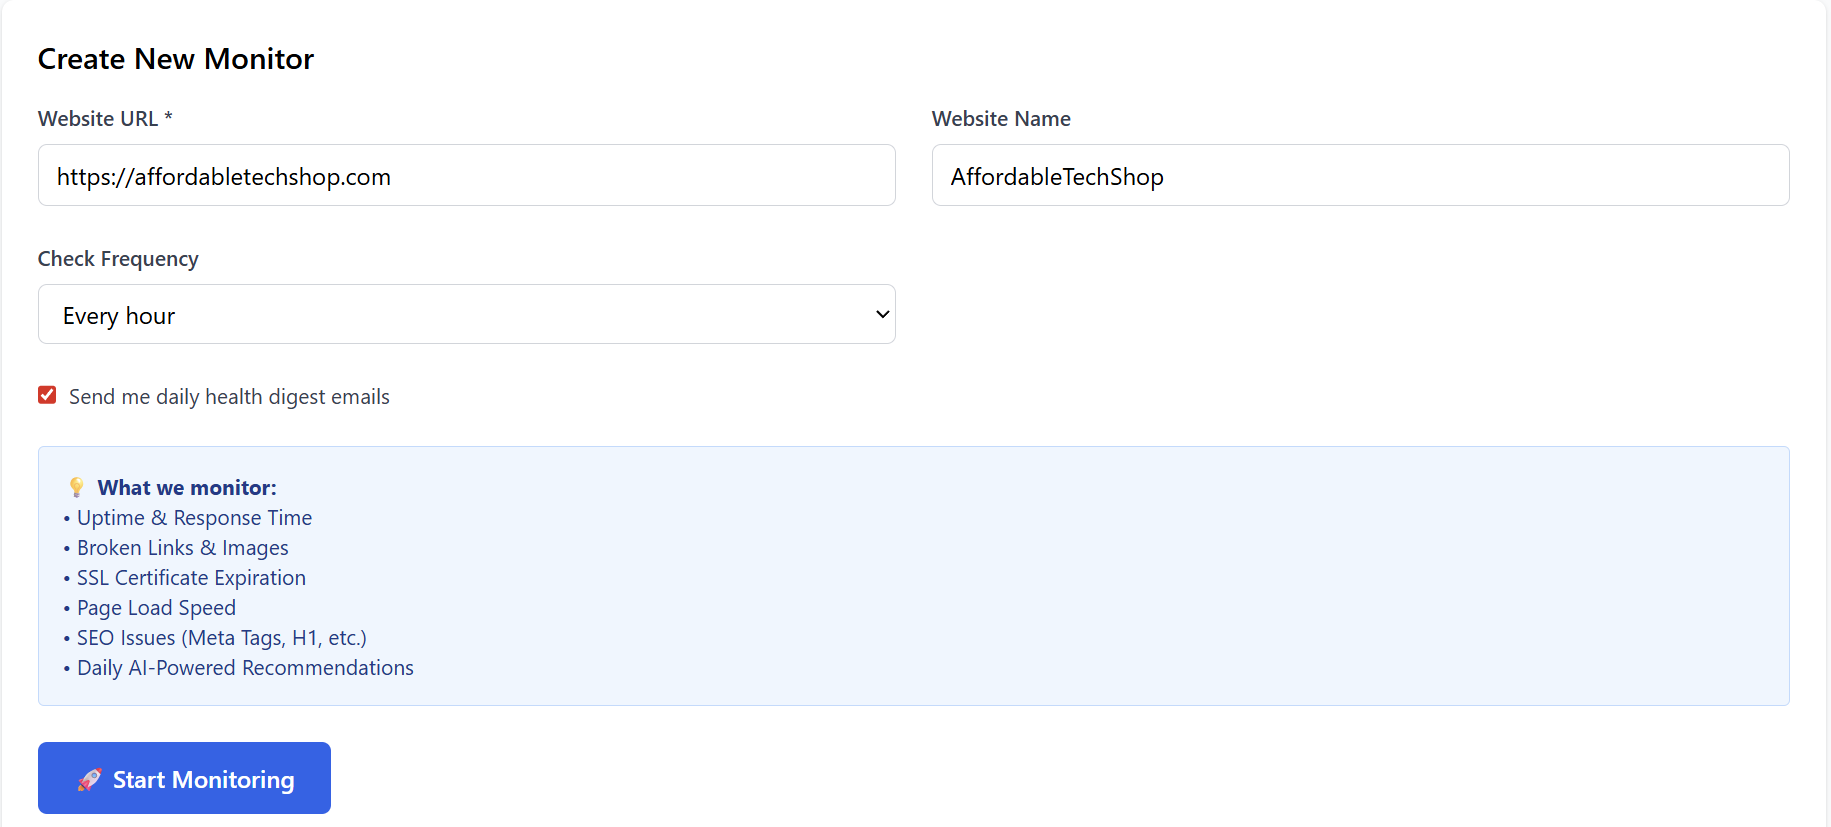


To begin, fill out:
1. Your Business Name
Example: Joe’s Pizza
2.
Business- Your
Category
Selectwebsite URL
3. Business Address
Start typing your address.A dropdown will appear—select your correct location.
4. Search Radius
Choose how farfrequency the systemchecks should scanbe formade competitors.Default:in (hourly, every 30/15/5 miles
5.
Choose the total number of local competitors to analyze.Default: 20 competitors
Start AI Analysis
Once all fields are filled, click this button to begin.
The system takes 2–3 minutes to:
-
Find competitors
-
Analyze their strengths and weaknesses
-
Compare them to your business
-
Generate AI insights for improvement
Once the Scan is done, 'Your Monitors' will display the results.
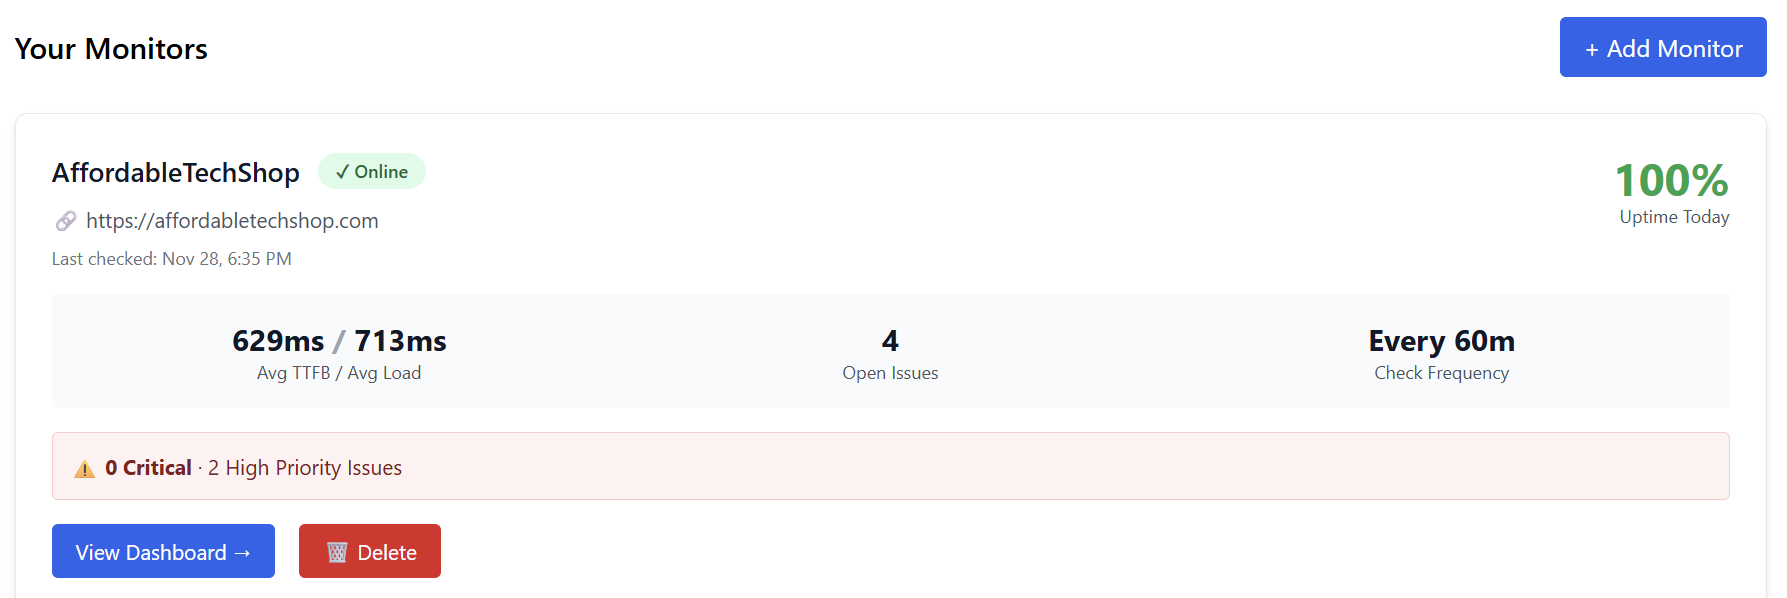
3. Viewing Your Monitor Dashboard
Once the analysis is complete, you can click -> View DashboardDashboard.
This opens a full report showing your website’s health , Example:
-
Performance
-
SEO
-
Security
-
Issues & errors
-
Uptime
-
Response times
-
Content health
-
AI-powered improvement recommendations
Below is a breakdown of each section.
4. Dashboard Breakdown
Business Overview
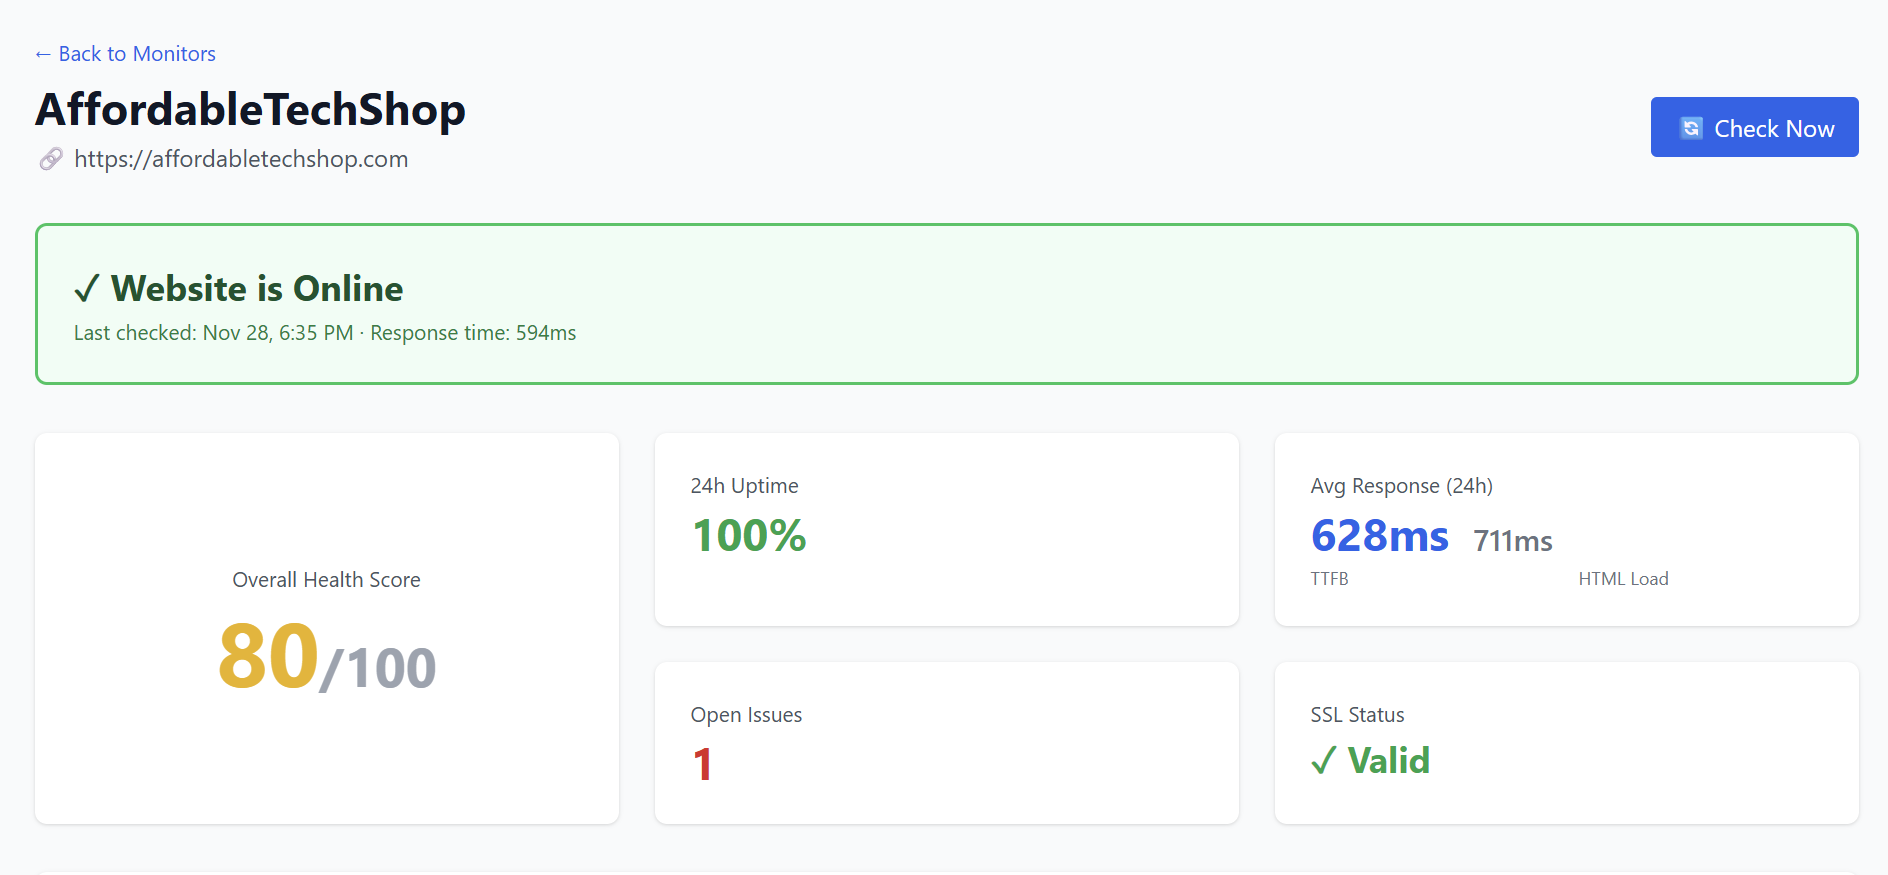
- Check Now: Runs an instant system scan.
- Overall Health Score:Score- > Example: 80/100
Calculated from:
-
SEO optimization
-
Performance & speed
-
Content structure
-
Server response
-
Security & SSL
The higher the score, the healthier your website.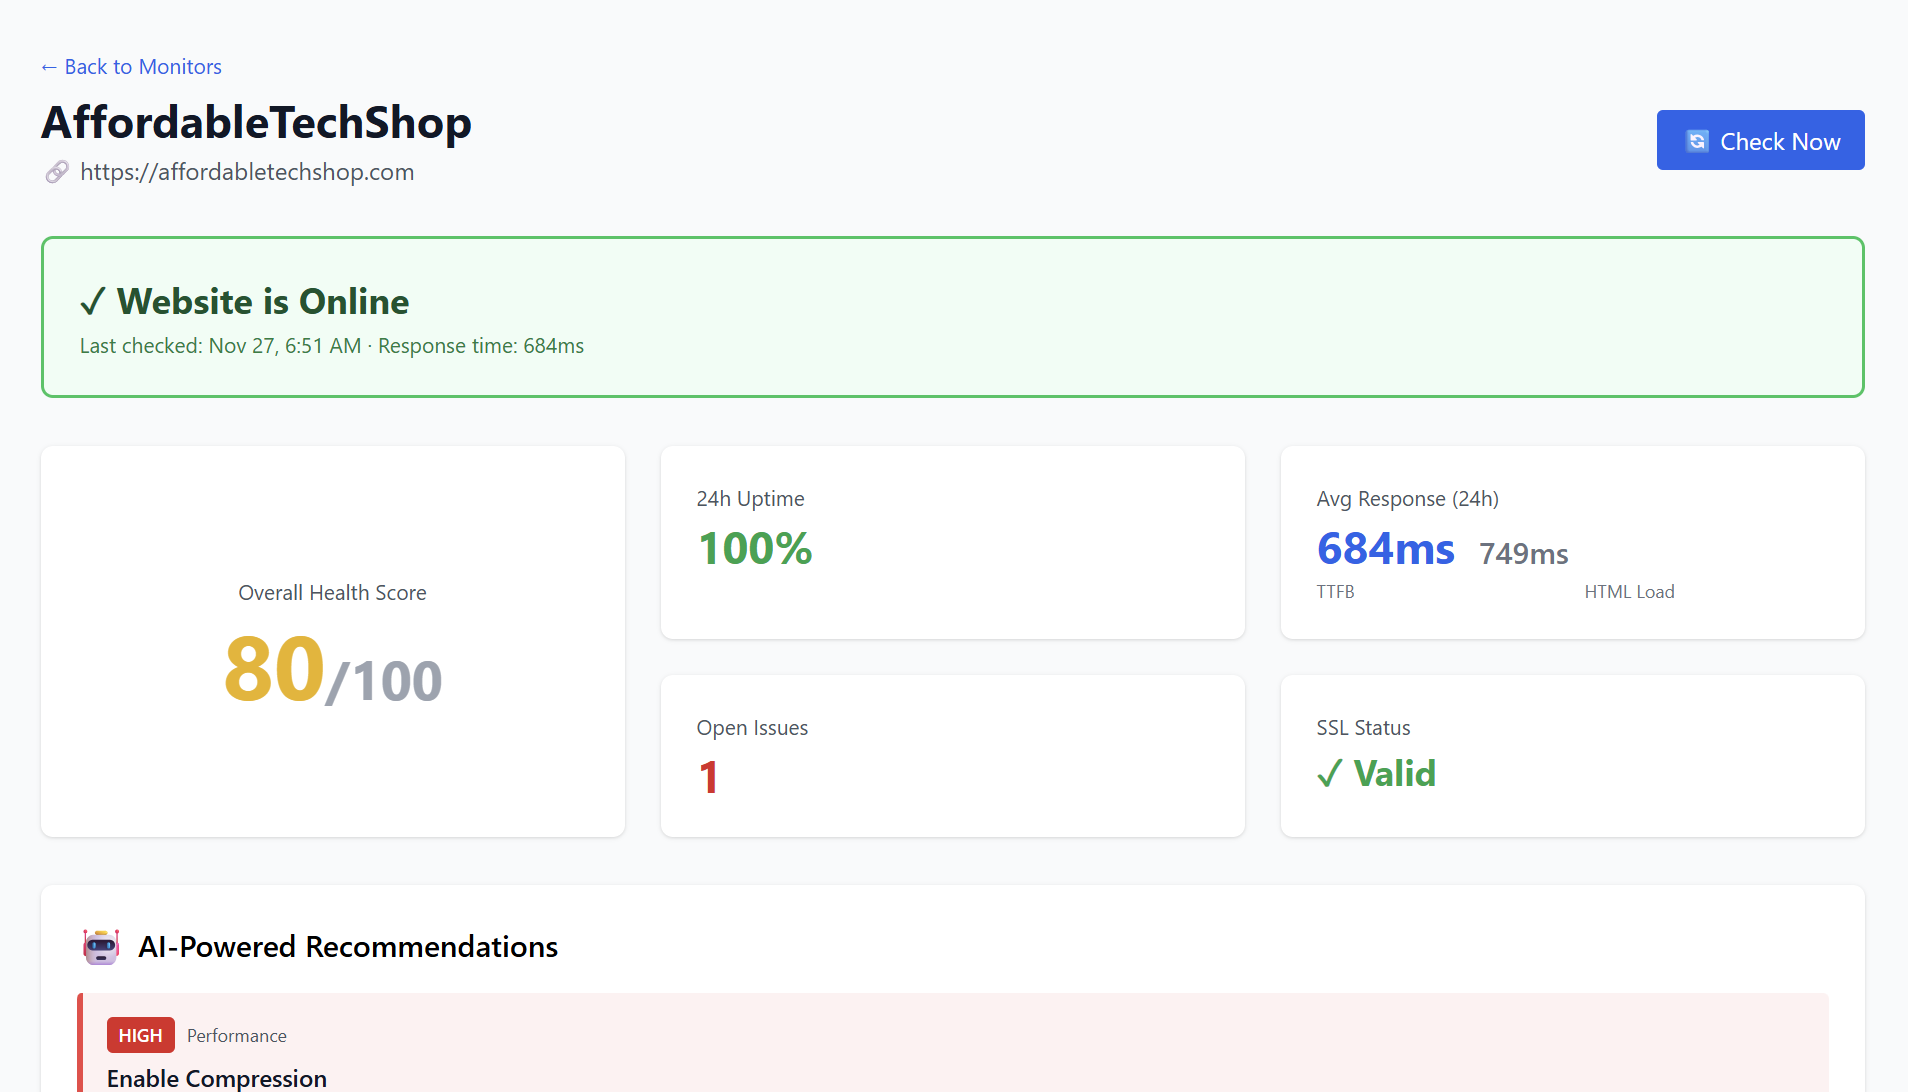
- 24-Hour Stats- Avg Response (24h): 684ms
- Open Issues: Displays any problems detected on the site.
- SSL Status: Shows whether your SSL certificate is:
-
Valid
-
Expired
-
Expiring soon
5. AI-Powered Recommendations
AI automatically categorizes issues by impact:
-
HIGH — Immediate improvements that create major gains
-
MEDIUM — Moderate impact
-
LOW — Optional improvements
Each recommendation includes:
-
What the issue is
-
Why it matters
-
Steps to fix it
-
Expected impact
Below is exactlyan example of how recommendations appear:
🔥 HIGH — Performance
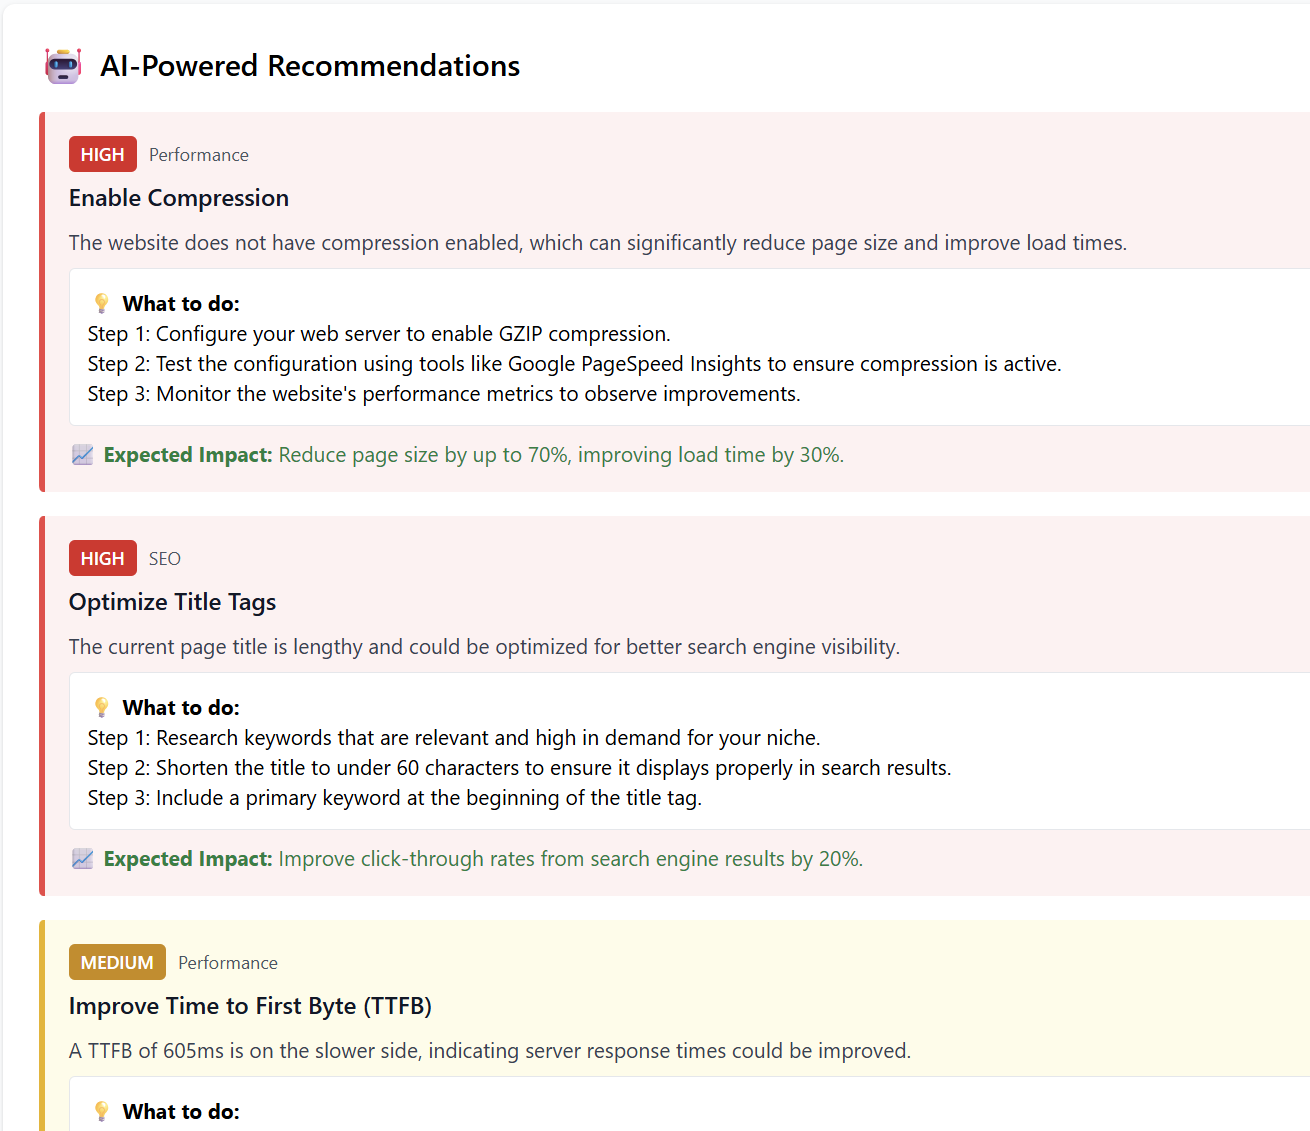
Enable Compression
Your website is not using GZIP/Brotli compression.
Why It Matters:Uncompressed files load slower → poor performance & UX.
How to Fix:
Enable GZIP/Brotli on serverCompress HTML, CSS, JSTest with PageSpeed Insights
Expected Impact:Reduce page size by 60%Improve load time by up to 50%
🔥 HIGH — SEO
Optimize Page Title
Your title is too long and may be truncated in search results.
How to Fix:
Keep page title under 60 charactersPut primary keyword firstMake the title compelling
Expected Impact:Increase organic traffic up to 15%
🟡 MEDIUM — Performance
Improve Time to First Byte (TTFB)
Current TTFB: 684ms (higher than ideal)
How to Fix:
Review server response & bottlenecksConsider hosting upgradeImplement a CDN
Expected Impact:Improve TTFB by up to 30%
🟡 MEDIUM — Security
Renew SSL Certificate Early
Expires in: 85 days
How to Fix:
Set reminder 30 days before expirationRenew through your SSL providerRe-verify HTTPS configuration
Expected Impact:Prevents security warnings from Google & browsers
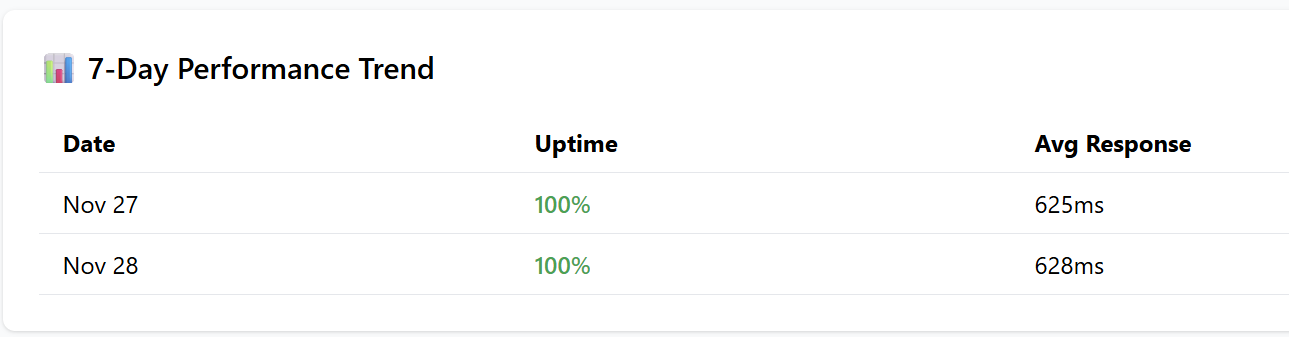
6. 📊 7-Day Trend
Shows:
Helps track stability and improvements over time.
7. ⚠️ All Open Issues
Each issue includes:
-
Category (Performance, SEO, Security)
-
Timestamp
-
Detailed description
-
Fix / Ignore options
Example: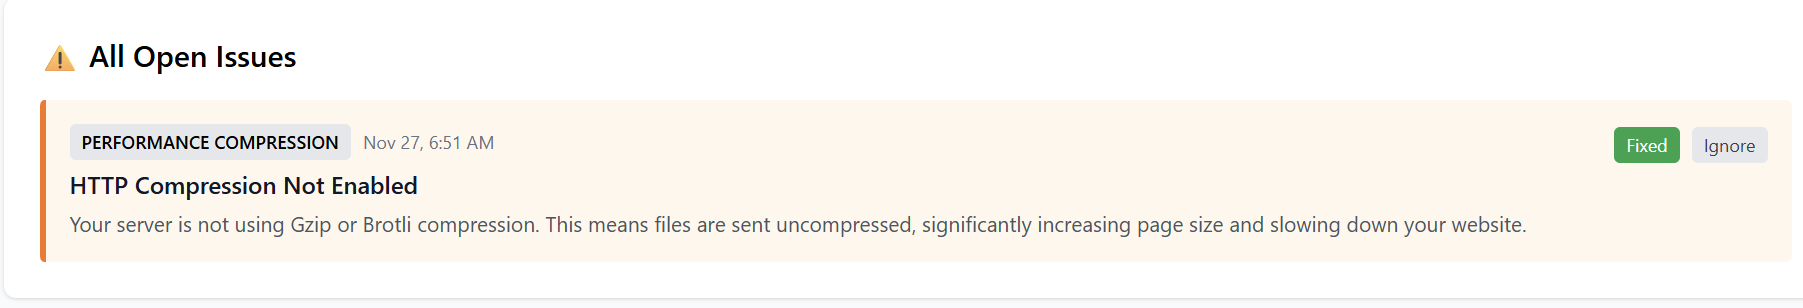
Performance — Compression
“HTTP Compression Not Enabled”Your server isn’t using GZIP/Brotli → larger files → slower site.
Options:
FixedIgnore
8. Content Health
The tool also analyzes:
-
Total words
-
H1 tag presence
-
Meta description
-
Missing alt tags
Example: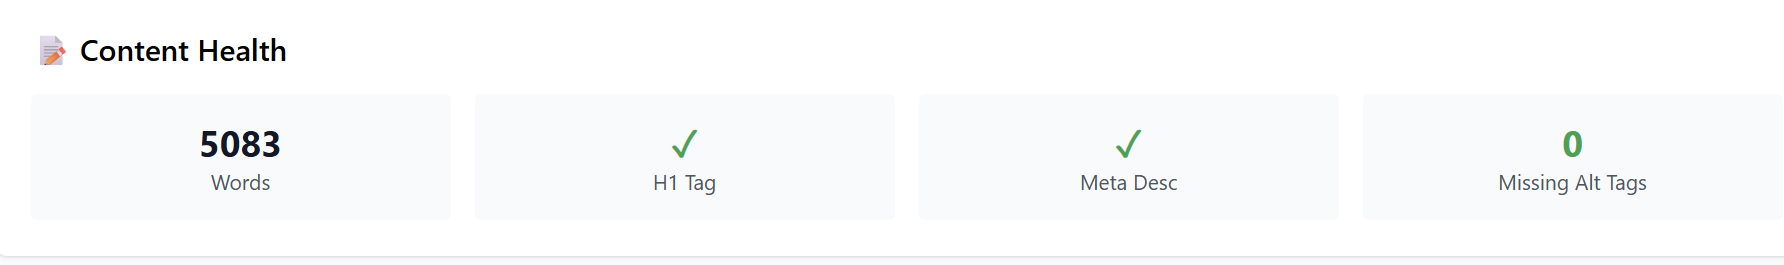
This helps boost SEO and ADA compliance.
9. Conclusion
The AI Local Market Domination dashboard gives you:
-
Clear website insights
-
Easy-to-follow recommendations
-
Visual performance tracking
-
SEO, performance, and security breakdowns
-
Competitive advantage in your local area
Once you follow the provided suggestions, your:
-
Rankings increase
-
Local visibility improves
-
Website becomes faster and more secure
-
Overall health score goes up