Introduction to the Resell Portal Platform
Welcome to your Resell Portal! This guide will walk you through the essential first steps to set up your account and prepare your digital storefront for sales. Follow these instructions to get your reselling business up and running.
Getting Started
To understand how the platform works, it's important to familiarize yourself with its three main components:
-
Your Reseller Dashboard: This is your central hub for managing your entire business. From here, you can oversee clients, track your profits, and configure your store settings. The topic you are currently on is part of your dashboard.
-
Your Public Storefront: This is the professional, customer-facing website where your clients will browse and purchase products and services. While we host the storefront, it is branded with your company's identity, not ours.
-
Your Wallet Balance: This is a pre-paid account used to cover the wholesale cost of the products you sell. When a customer makes a purchase on your storefront, the wholesale price is automatically deducted from this wallet, and you instantly receive the difference as profit. You can also use this balance to manually add services for clients.
Launch Your Business
To launch your business and begin making sales, follow these four essential steps. You can find all the necessary settings in the navigation menu on the left side of your dashboard.
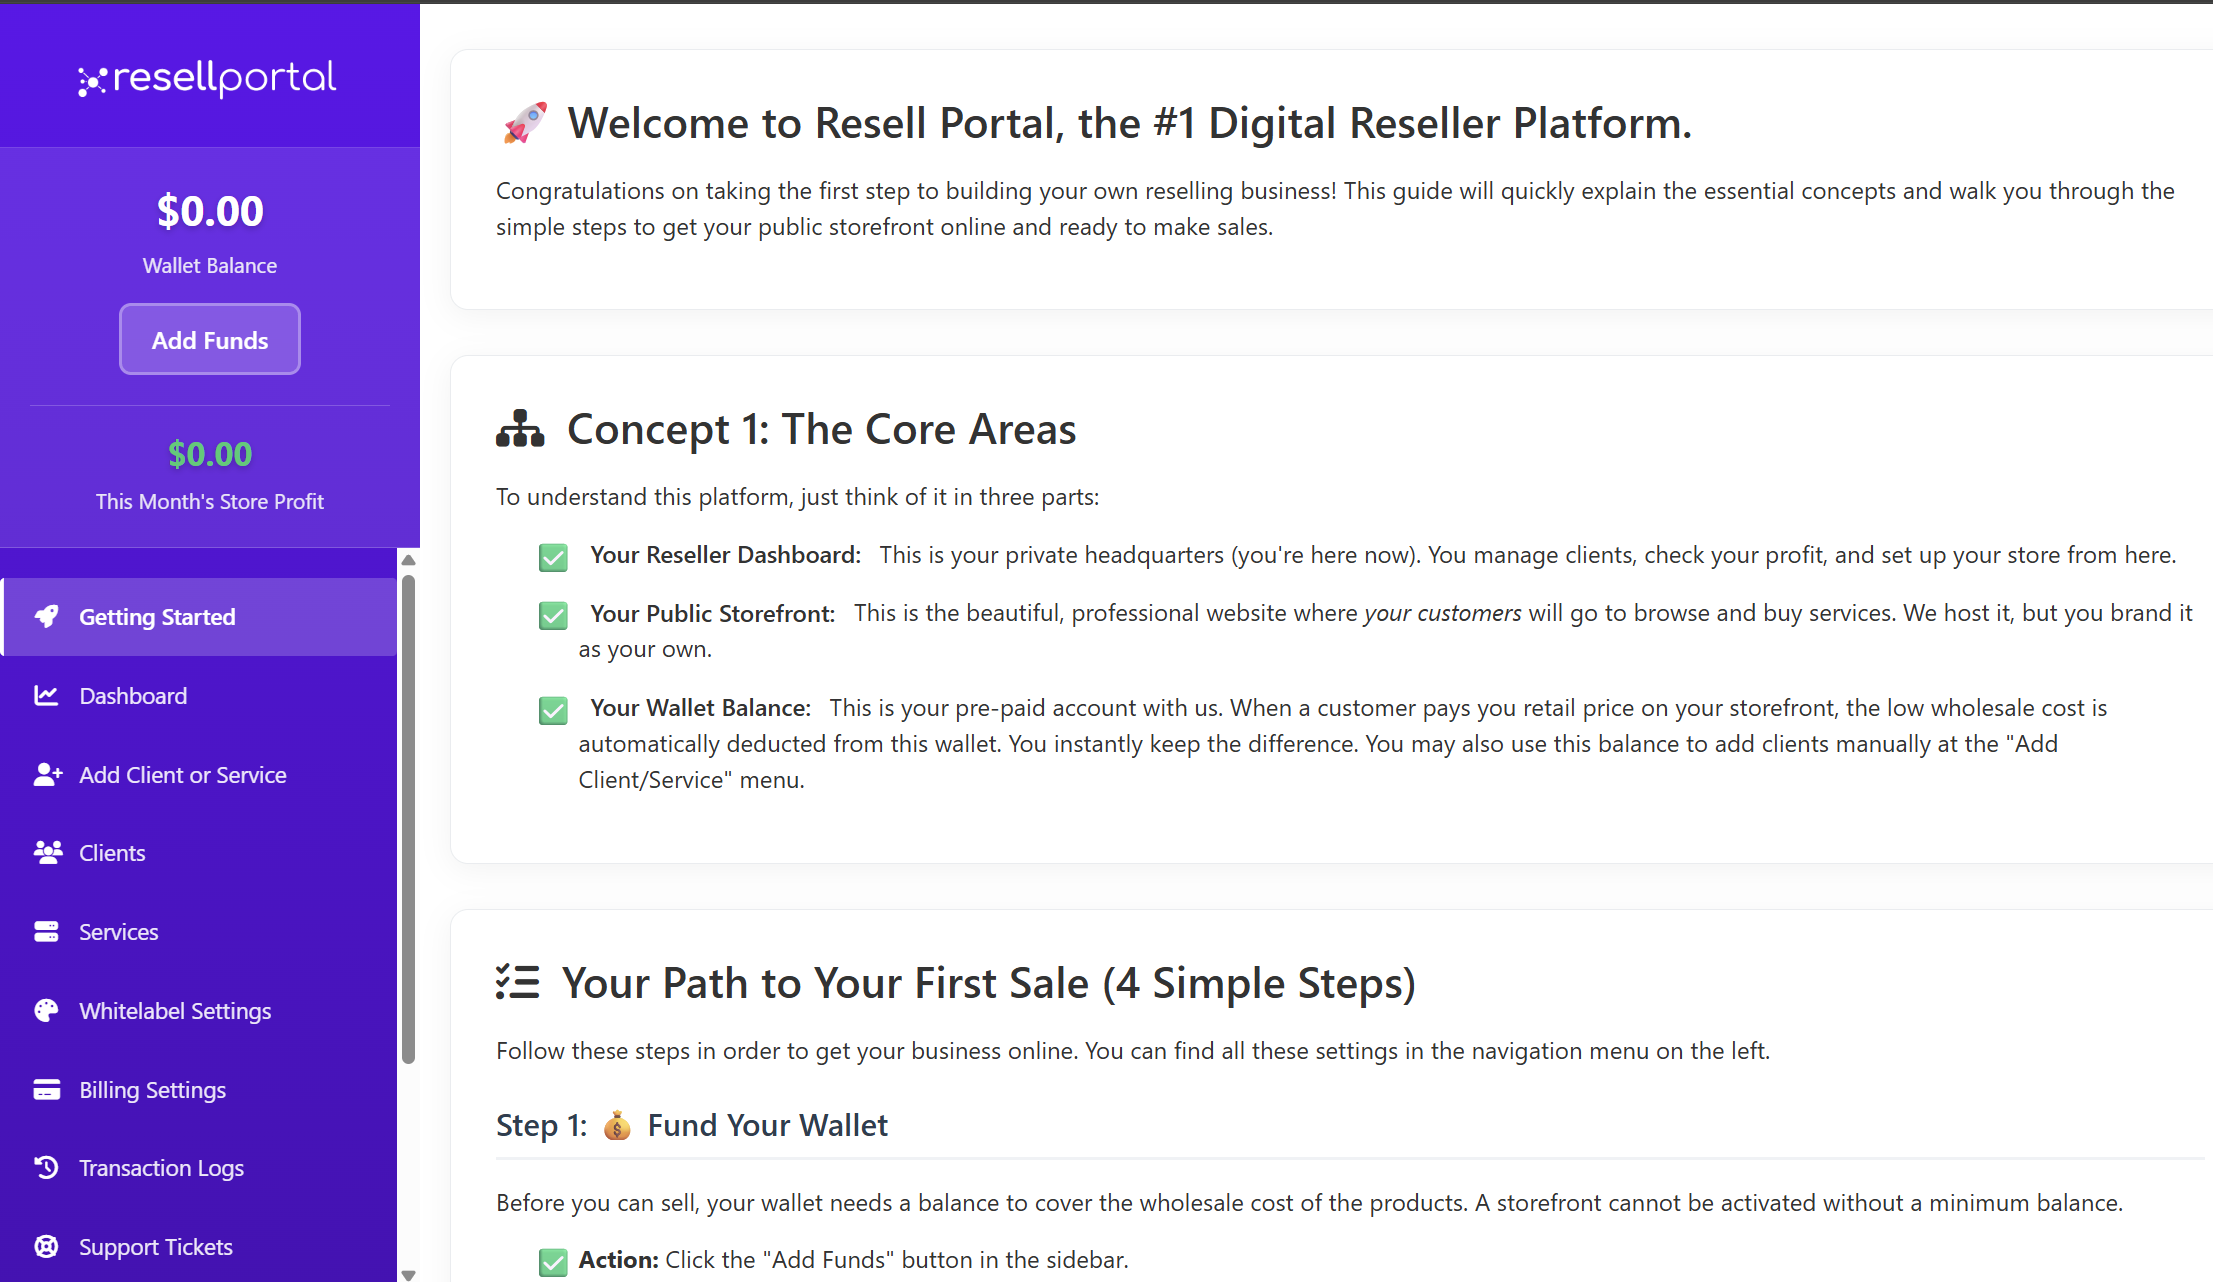
Step 1: Fund Your Wallet
Before you can offer products to customers, your wallet needs a balance to cover the wholesale costs. A storefront cannot be activated without a minimum balance.
-
Click the "Add Funds" button located in the sidebar on the left.
-
Recommendation: A minimum of $20.00 is required to activate your storefront, but we suggest starting with at least $50.00 to ensure smooth initial operations.

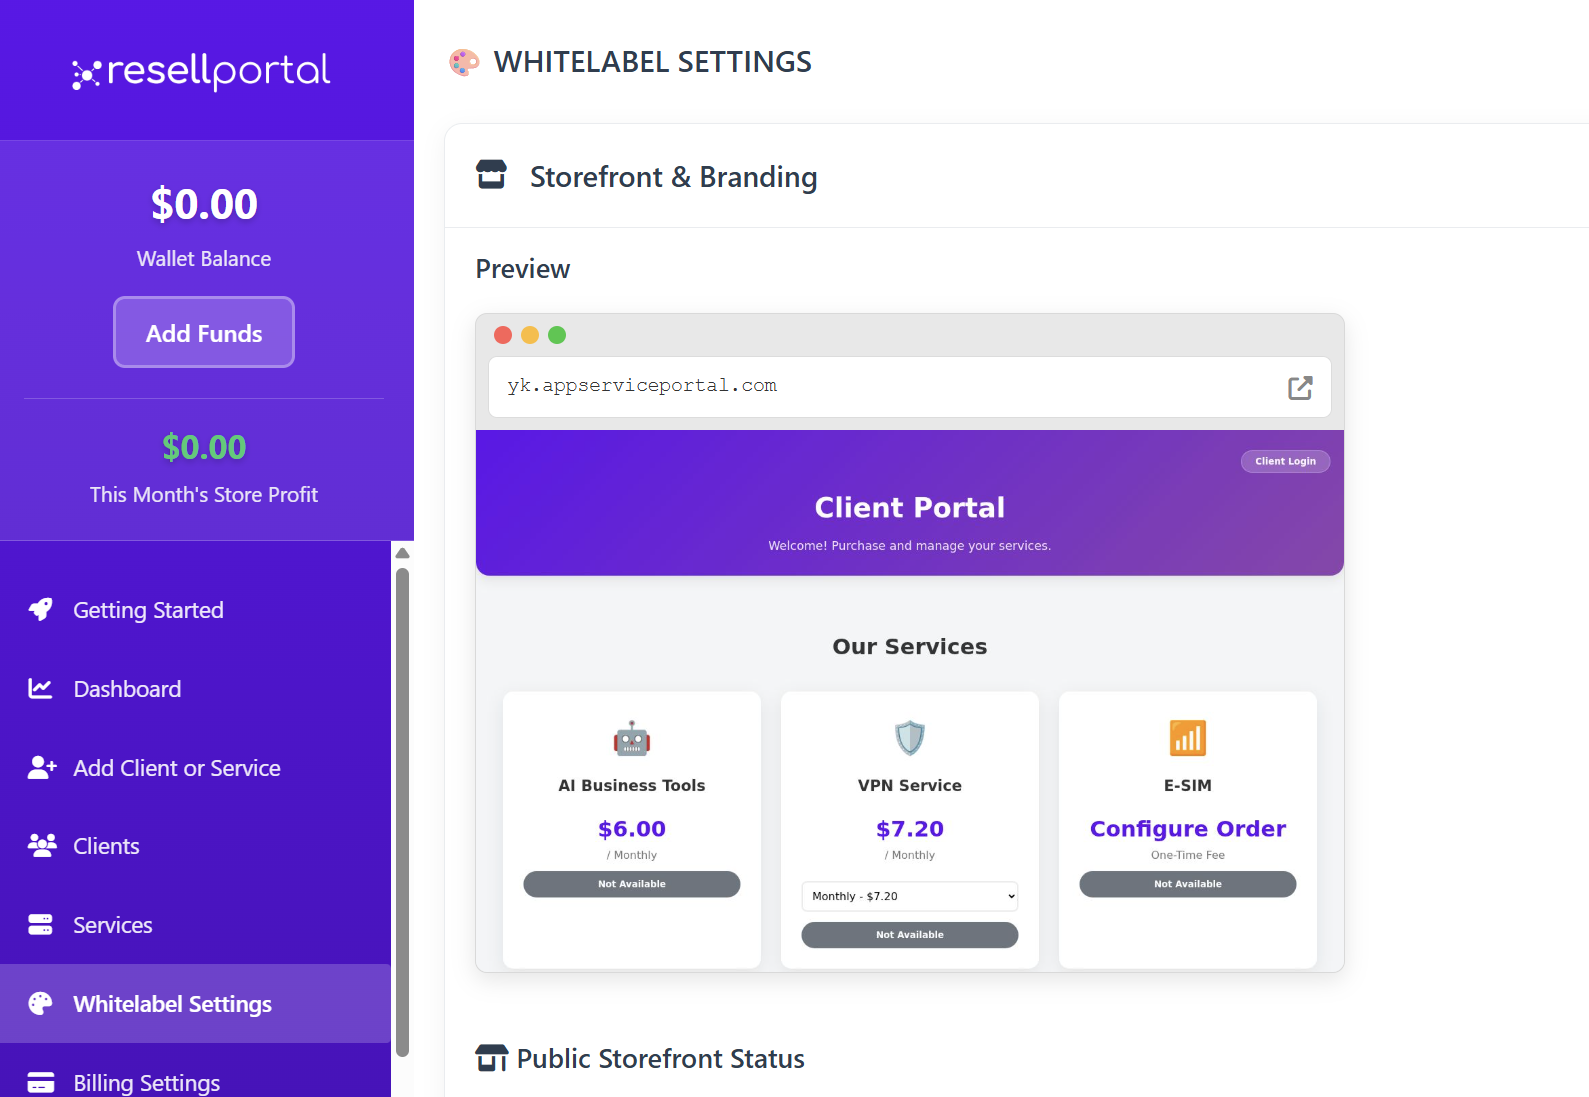
Step 2: Brand Your Store & Choose Your Domain
This step focuses on customizing your storefront to reflect your brand. This is what your customers will see.
-
Navigate to the Whitelable Settings topic - first section Storefront & Branding.
-
Most Important: Upload your company logo and select a unique domain for your storefront. This can be a custom domain you own or a subdomain provided by us (e.g., your-store.appserviceportal.com). This URL is how your customers will find you.

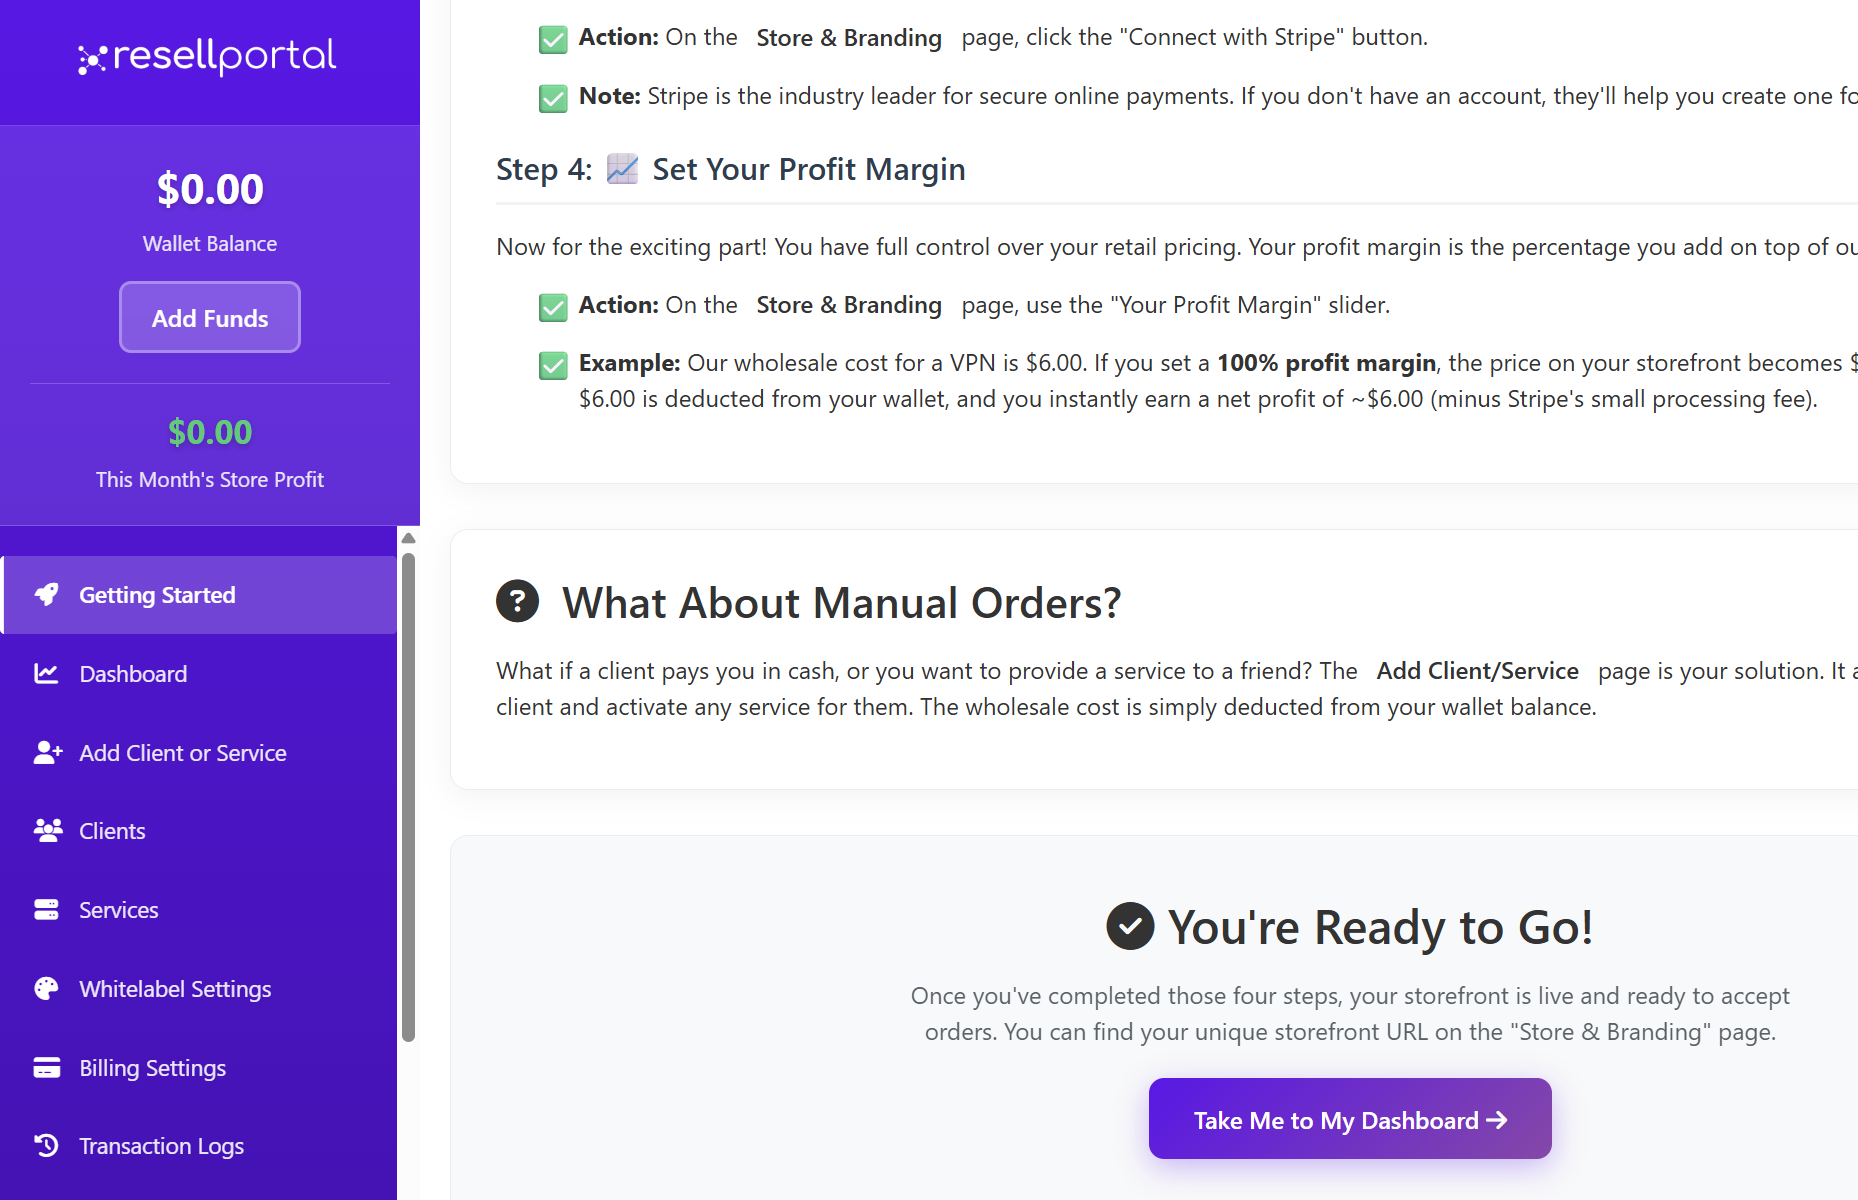
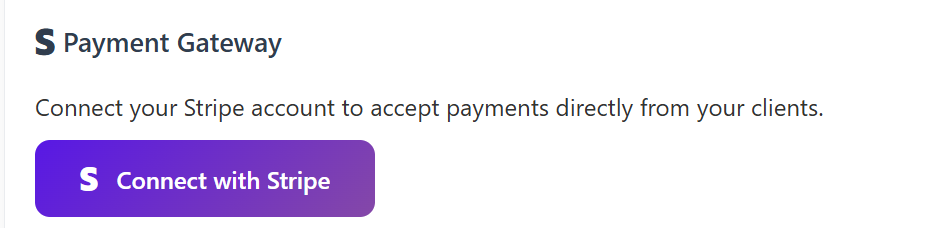
Step 3: Connect a Payment Gateway
To get paid by your customers, you need to connect a payment processor. When a customer buys from your storefront, their payment will go directly into your own Stripe account. We never handle your customers' money.
-
On the Store & Branding section under Whitelabel topic, find and click the "Connect with Stripe" button.
-
Note: Stripe is a leading platform for secure online payments. If you don't have a Stripe account, you will be prompted to create one for free during this process.

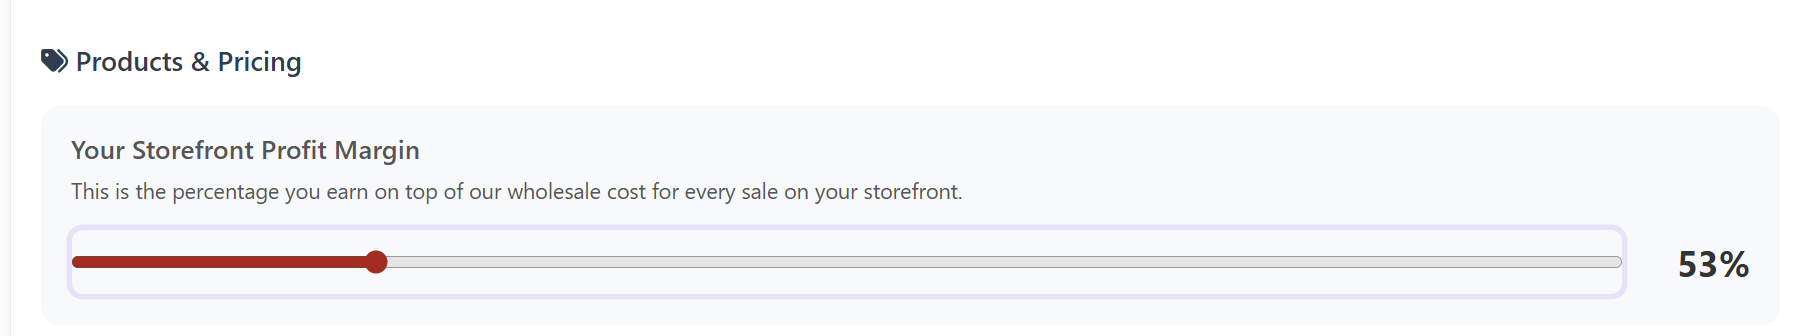
Step 4: Set Your Profit Margin
This is where you determine your pricing and profitability. You have complete control over the retail prices by setting a profit margin, which is the percentage you add on top of our wholesale costs.
-
Storefront & Branding section-> use the "Your Profit Margin" slider to set your desired margin.
-
Example: If a product has a wholesale cost of $6.00 and you set a 100% profit margin, the price on your storefront will be $12.00. When a customer purchases it, $6.00 is deducted from your wallet, and you instantly earn a net profit of $6.00.

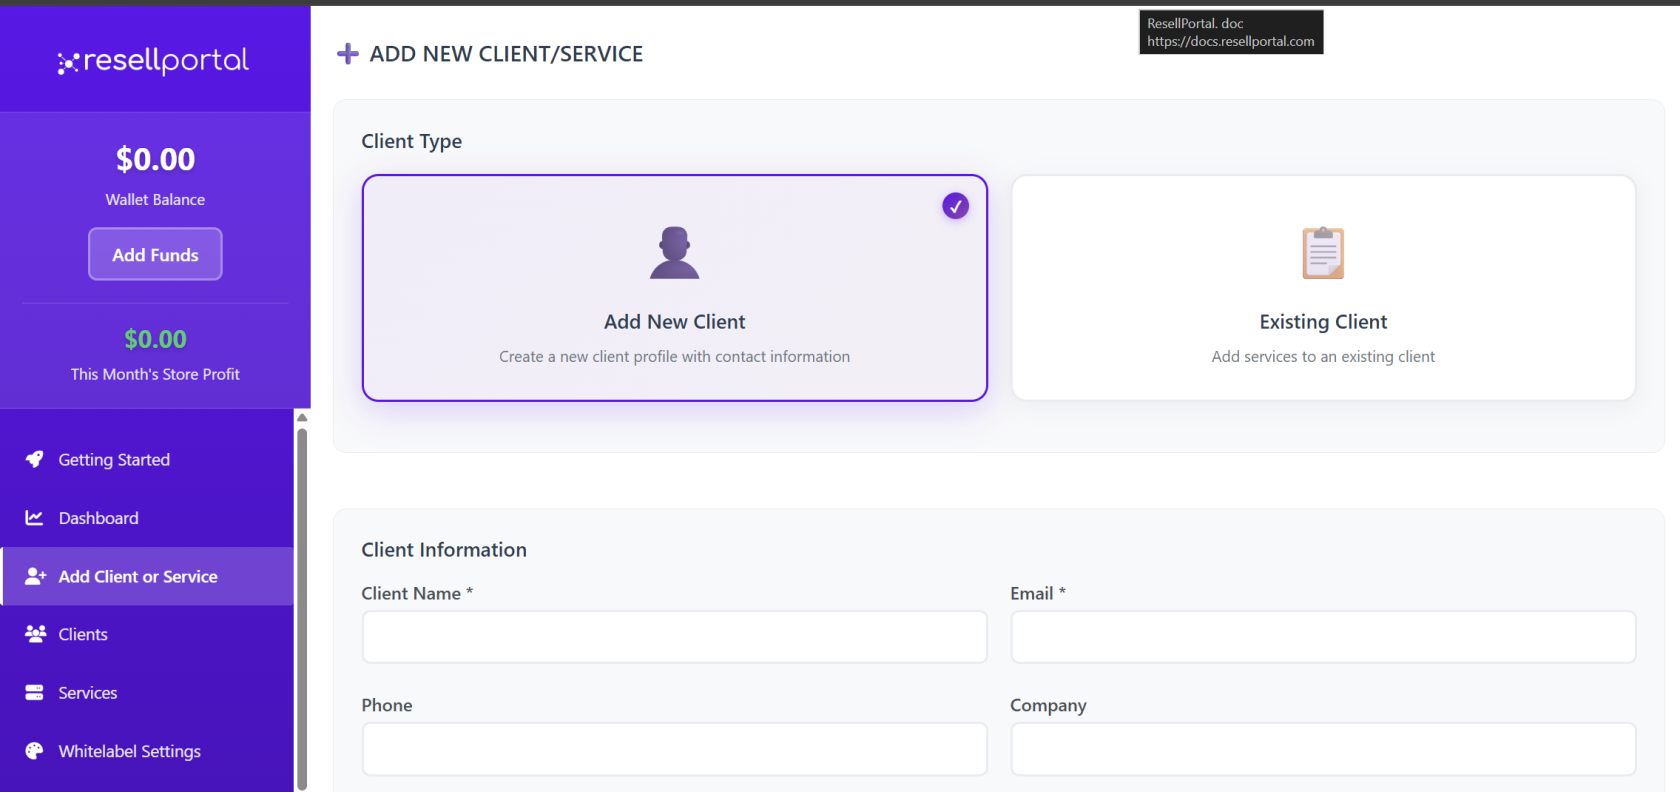
What About Manual Orders?
If you need to manually create an order for a client—for instance, if they pay you in cash or you want to provide a service to a friend—you can do so easily.
-
The Add Client/Service topic allows you to manually create a client and activate any service for them. The wholesale cost for the service will be deducted from your wallet balance.

You're Ready to Go!
Once you have completed these four steps, your storefront will be live and ready to accept orders. You can find your unique storefront URL on the "Store & Branding" topic.
Now you are all set! Click the "Take Me to My Dashboard" button to continue exploring your Resell Portal.