
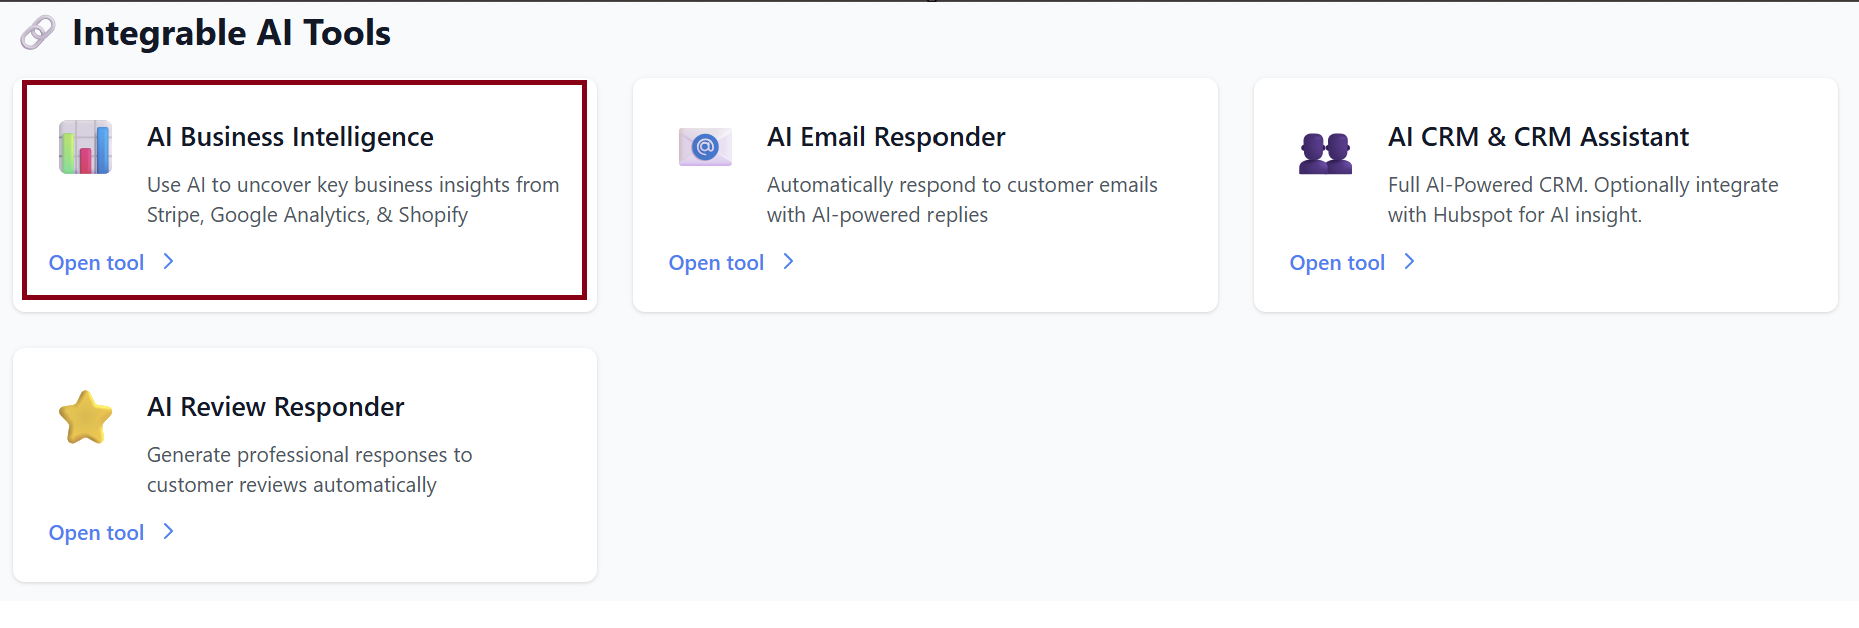
AI Business Intelligence
Welcome to Business Intelligence—your all-in-one dashboard for real-time analytics, anomaly detection, and AI-powered recommendations.
This guide will help you understand each section of the dashboard and how to get the most out of your data.
1. Overview
The Overview topic gives you a quick snapshot of how your business is performing today.
Today’s Metrics
Each metric compares today’s performance to yesterday:
-
Today's Revenue 💰
Shows all revenue collected today.-
Arrow ↑ or ↓ indicates growth or decline compared to yesterday.
-
-
Today's Orders 🛒
Number of orders placed today. -
Today's Visitors 👥
Total website visitors today.
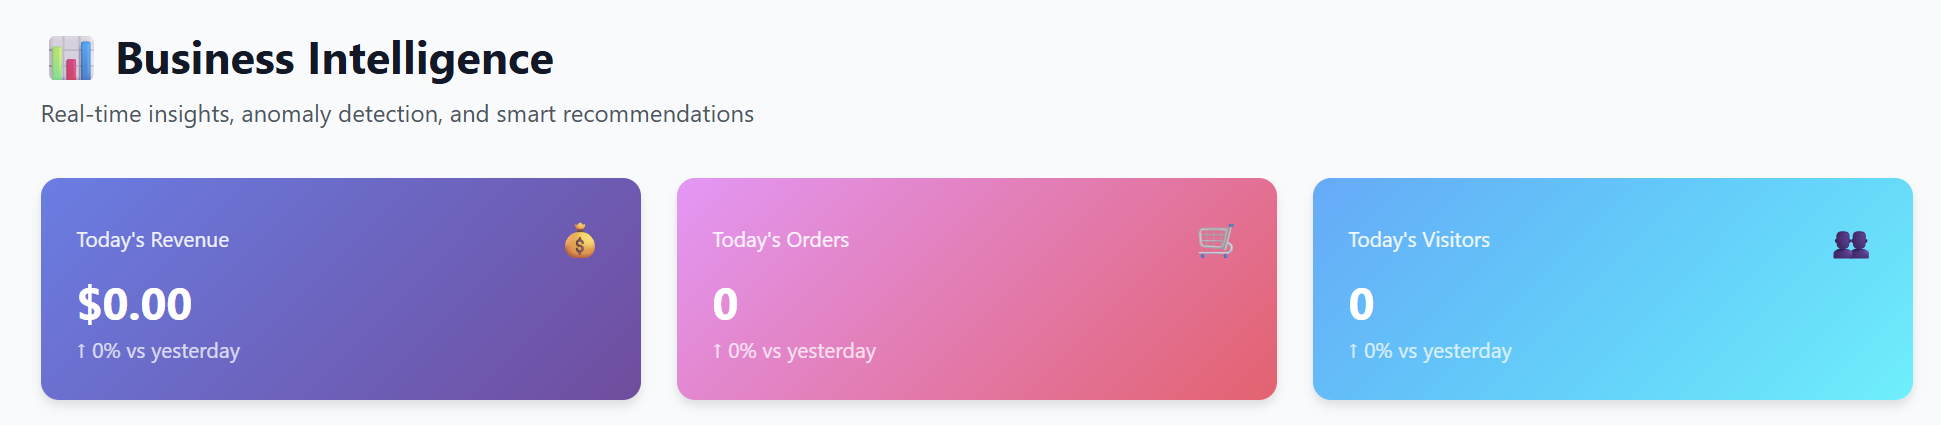
These values automatically update in real time as new data comes in.
30-Day Trends
You’ll see easy-to-read charts showing:
-
💰 Stripe Revenue (30 days)
-
🛒 Shopify Orders (30 days)
-
👥 Google Analytics Traffic (30 days)
These help you quickly visualize long-term performance patterns.
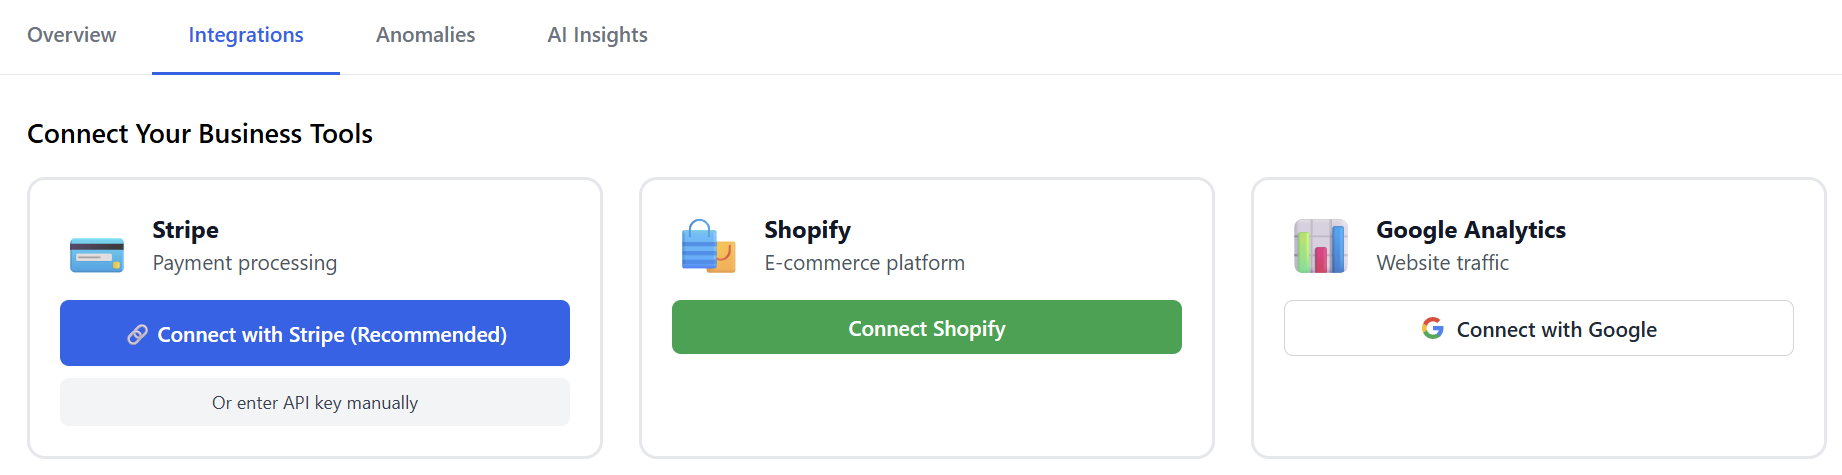
2. Integrations
The Integrations tab allows you to connect your business tools so the dashboard can pull in data automatically.
Available Integrations
Stripe – Payment Processing
Use this to sync your revenue.
-
Click Connect with Stripe (Recommended)
→ You’ll be redirected to Stripe’s secure login. -
Alternatively, you can enter your API key manually.
Shopify – E-commerce Platform
Connect Shopify to sync orders and store activity.
-
Click Connect Shopify
→ Approve the app inside your Shopify admin.
Google Analytics – Website Traffic
Sync your website visitor data.
-
Click Connect with Google
→ Sign in to your Google Account and choose a property.
After Connecting
Once integrations are enabled:
-
Metrics begin populating.
-
Trends update automatically.
-
AI Recommendations unlock.
3. Anomalies
The Anomalies tab monitors your data 24/7 to detect unusual patterns, sudden drops, or unexpected spikes.
What You’ll See
-
If everything looks normal:
“No anomalies detected. Your metrics look healthy!”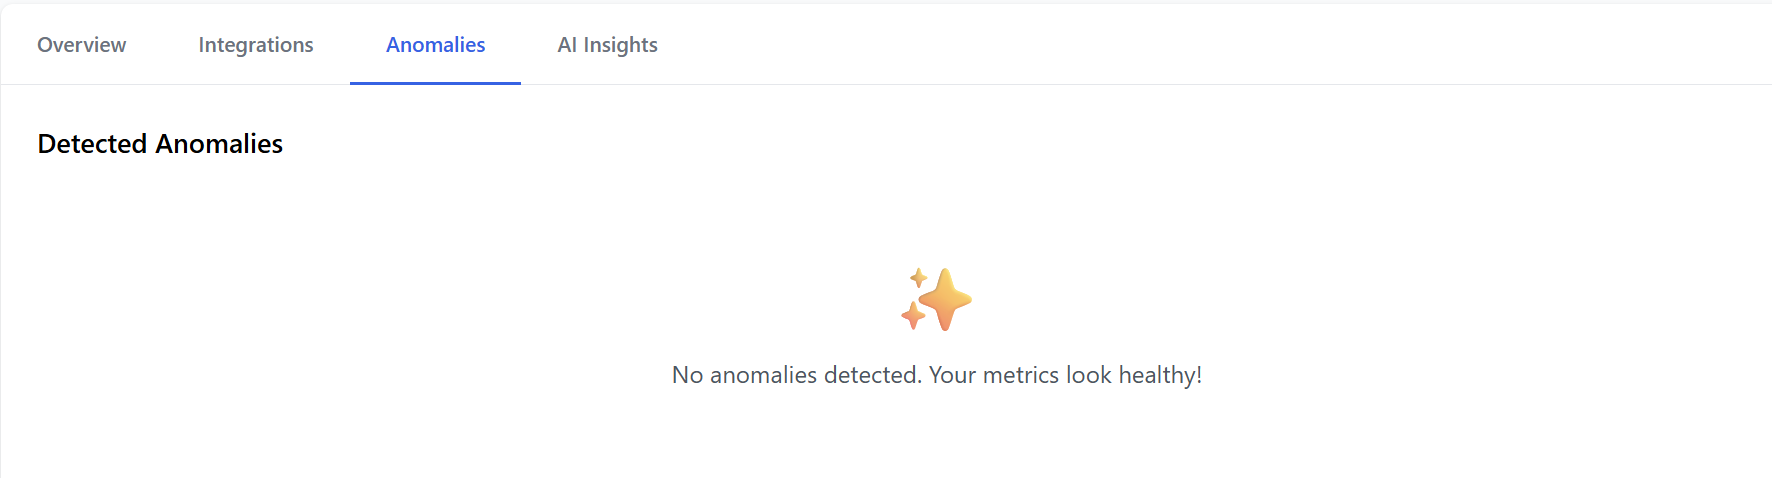
-
If something unusual happens (example):
-
Revenue spike or dip
-
Sharp increase in failed Shopify checkouts
-
Unexpected drop in website traffic
-

The system will highlight the anomaly with details like:
-
When it happened
-
Severity
-
Possible causes
-
Suggested next steps
This helps you catch problems early—such as technical issues, failed payment events, or marketing performance drops.
4. AI Insights
The AI Insights tab provides smart recommendations based on your connected data.
Examples of AI Insights
-
“Your conversion rate dropped 12% yesterday—likely due to fewer mobile visitors.”
-
“Your average order value is rising. Consider promoting bundles to maximize revenue.”
-
“Traffic is increasing but orders are flat. You may want to review your checkout flow.”
If No Integrations Are Connected
You’ll see:
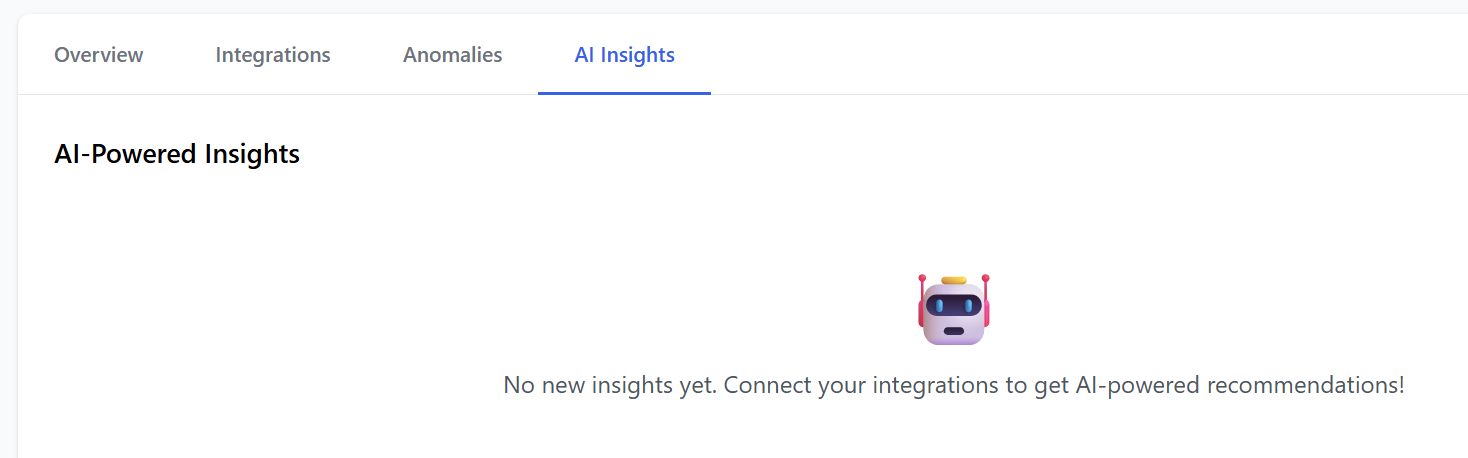
Once data flows in, insights become available automatically.
Summary
| Tab | What It Does |
|---|---|
| Overview | Real-time revenue, orders, visitors + 30-day trends |
| Integrations | Connect Stripe, Shopify, and Google Analytics |
| Anomalies | Automatically detects unusual activity |
| AI Insights | Gives recommendations to boost performance |
By connecting all integrations, you unlock the full power of the dashboard—real-time awareness, smarter decisions, and peace of mind.